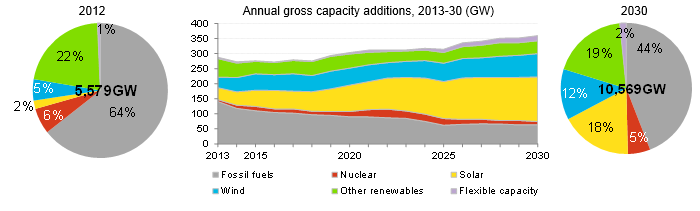
Global installed capacity mix and projected additions, by technology (GW) Bloomberg
A prediction from Bloomber New Energy Finance: 2030 Market Outlook, has been released showing Bloomberg's energy division's view of the new financial investment the expect in the next 16 years. Note they include nuclear as a "renewable" which changes the definition.
Bloomberg does not say much about their model, or assumptions. This scenario looks conservative to me in terms of the amount of renewable capacity additions, and excessive for the number of additional fossil fuel plants added, especially in the late 20s, however you know what they always say, "a projection in hand, is worth two in the archives," so I'm sharing this one with you now and hope we can add some additional more optimistic projections showing a faster transition to renewable energy, this evening after work.
Also note the text indicates indicates different percentages than their 2030 pie chart. So in the title I used an estimate from the chart instead of the text which appears to have two misprints. I'm showing this mostly as a conversation starter.
By 2030, the world’s power mix will have transformed: from today’s system with two-thirds fossil fuels to one with over half from zero-emission energy sources. Renewables will command over 60% of the 5,579GW of new capacity and 65% of the $7.7 trillion of power investment.Bloomberg says little about their "model" or assumptions which appear to be mostly an extrapolation of current trends for half of this scenario, with almost straight-line runs outs from 2025.Rooftop solar PV will dominate, taking up a fifth of the capacity additions and investment to 2020. But fossil fuels will maintain a 54% share of generation – albeit down from 67% in 2013. ...
If governments wish to decarbonise their power sectors by 2030, they cannot rely on economics (ie, declining renewable technology costs) and market forces alone - some form of policy intervention will be required.
This prediction also includes no pressure from policy decisions to limit carbon emissions, so we do not see anywhere near sufficient reduction in burning fossil fuels. Note that the middle chart is capacity "additions. So these authors assume the world is going to keep building substantial numbers of new fossil fuel plants steadily through the next 16 years.
I'll have to check more carefully, but I'm fairly confident this scenario does not come close to limiting global warming to our benchmark goal of 2 degrees centigrade.
Remember, this is not a scholarly model, but a market research model, one has to become a Bloomberg client to see the details of. From the looks of this chart my guess is most of their clients are major players in the traditional fossil fuel industry.
Despite these limitations I appreciate when authors put a stake in the ground and show their assumptions about the world's total energy demand, and capacity mix out through 2030.
I'm going to find out as many others as I can. I remember one from Scientific American almost a decade ago that illustrated a plan to have all new additions of capacity coming from renewable by 2030, which I support as a global goal.
Even without any policy pressures to reduce greenhouse gas emissions we should see a greater contribution from solar and wind even in the first years.
I thought you might like to see our total gigawatts summed up in three charts. Bloomberg also has estimates broken down by continents which I will show later. I have to get back to work. I hoping to drop in later this evening. I can never see word gigawatts without thinking of the scientist in Back to the Future.
Cheers, and keep your sunny side up.